Why VIX trackers don't track the VIX

This post is inspired by a discussion I recently had with a friend of mine. He observed that volatility has spiked over the past few weeks due to concerns about COVID-19. Furthermore, he pointed out that there was enough publicly available information about the virus back in January to anticipate both its global spread and the ensuing effect on volatility. He wanted to know what methods exist for trading on this prediction, and specifically whether it is possible to buy something which tracks the VIX.
I pointed him to VXX, an ETN designed to “provide access to equity market volatility through CBOE Volatility Index® (the “VIX Index”) futures”. VXX, like its levered siblings TVIX and UXVY, is designed to match the daily returns of an index of short-term VIX futures contracts. It allows ordinary investors to take positions that are long volatility.
It is tempting to think of VXX as a “VIX tracker”, in the same way that SPY is a tracker for the S&P 500. But there are important differences between the two. The price of SPY follows the value of its underlying index so closely that for most investors the differences are negligible. VXX, on the other hand, really only mirrors changes in the VIX over periods of a few days (and sometimes not even that). For longer periods of time, the cumulative change in VXX can be quite different than the cumulative change in the VIX.
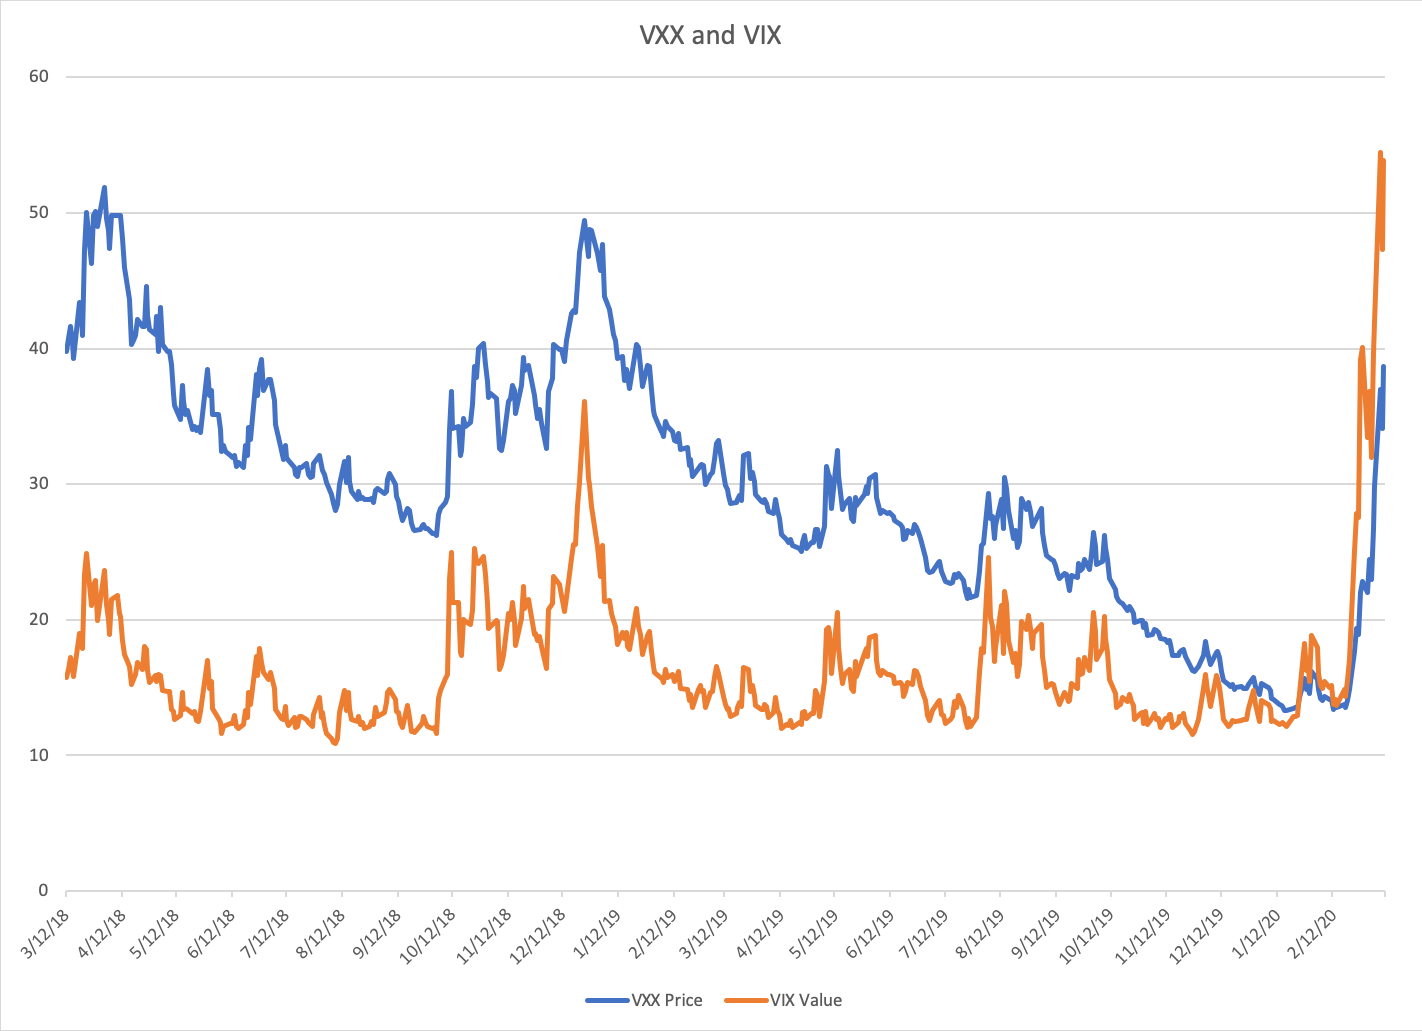
The chart above shows the price of VXX and the value of the VIX over the past two years. There is a clear day-to-day correlation between the two time series. But note that VXX has a downward trend which is not present in the VIX. This trend is so strong that if you had bought VXX on 3/12/18 and held it until now, you would have lost money overall, even though the VIX is up almost 250% over that period.
The same pattern appears in the other VIX trackers like TVIX and UVXY. They move in concert with the VIX on a day-to-day basis, but suffer heavy losses over time while the VIX remains flat. Why do these trackers lose so much money in quiet markets? The remainder of this post will attempt to answer that question.
Indexes and futures and ETNs, oh my!
Before we can address the return characteristics of VXX relative to the VIX, we first need to understand all the moving parts involved in the VIX and its derivatives.
The foundation of the ecosystem is of course the VIX itself. Developed by CBOE, the VIX is an index which uses options prices to derive an estimate of near-term volatility in the S&P 500. Specifically, the VIX represents the expected annualized standard deviation of the S&P 500 over the next 30 days. The exact formula for this calculation can be found here, and for a deeper dive into where the formula comes from, see here.
Since the VIX is just a number, there is no way to trade it directly. But CBOE solved this problem by listing monthly futures contracts which settle to the value of the VIX at expiration. These contracts allow traders to effectively take either long or short positions in the value of the VIX.
The downside of futures contracts is that each contract has an expiration date, and so buying any particular contract will only give you exposure to the underlying value for a limited amount of time. The standard solution to this problem among futures traders is to periodically roll positions forward by selling contracts about to expire and replacing them with contracts expiring later. VXX and the other trackers roll their positions incrementally each day, so that on any given day the average time to expiration of the contracts in their portfolio is exactly 30 days.
Finally, as a matter of convenience for investors, the rolling portfolio of VIX futures is wrapped in a formal legal structure and listed on an exchange. This structure varies somewhat between the trackers — VXX is an ETN whereas TVIX and UVXY are ETFs — but the differences aren’t really important here. Both types of structure serve the same purpose, which is to allow investors to experience the returns of the rolling futures portfolio by simply buying and holding a single asset.
So you can think of VXX as sitting three layers of financial abstraction above the VIX. Layer one uses futures contracts to convert the VIX from a mathematical construct into a tradable asset. Layer two involves constructing a portfolio of multiple futures contracts which is continuously rolled forward so that it never expires. And layer three is the creation of an exchange-traded product as a convenient wrapper around this portfolio.
Pinpointing the leak
With this picture in hand, we can now address the original question — why does VXX bleed money so quickly? To identify the source of the bleeding, we will look at each layer of VXX’s construction individually.
There is no reason to expect the first layer, the use of futures contracts which settle to the value of the VIX, to introduce significant costs. A futures contract is simply a bet about the value of an underlying quantity at some point in the future. There are no ongoing fees or interest rates associated with holding an open futures position. The only potential source of expenses are broker commissions and the bid-ask spread, both of which should be minimal in this case.
The third layer can explain a small portion of the costs, since there are legal and operational fees associated with maintaining an exchange-traded product. But these costs are minimal, and for a product with an AUM as high as VXX (particularly an ETN) they should come out to less than 1% annualized.
This leaves the second layer as the likely culprit. What kinds of costs are associated with maintaining a rolling futures portfolio? As with layer one, there will be small costs from paying transaction fees and crossing spreads, but these costs are nowhere near the level of drag experienced by VXX. The real cost of rolling VIX futures comes from the fact that contracts with different expiration dates have different prices.
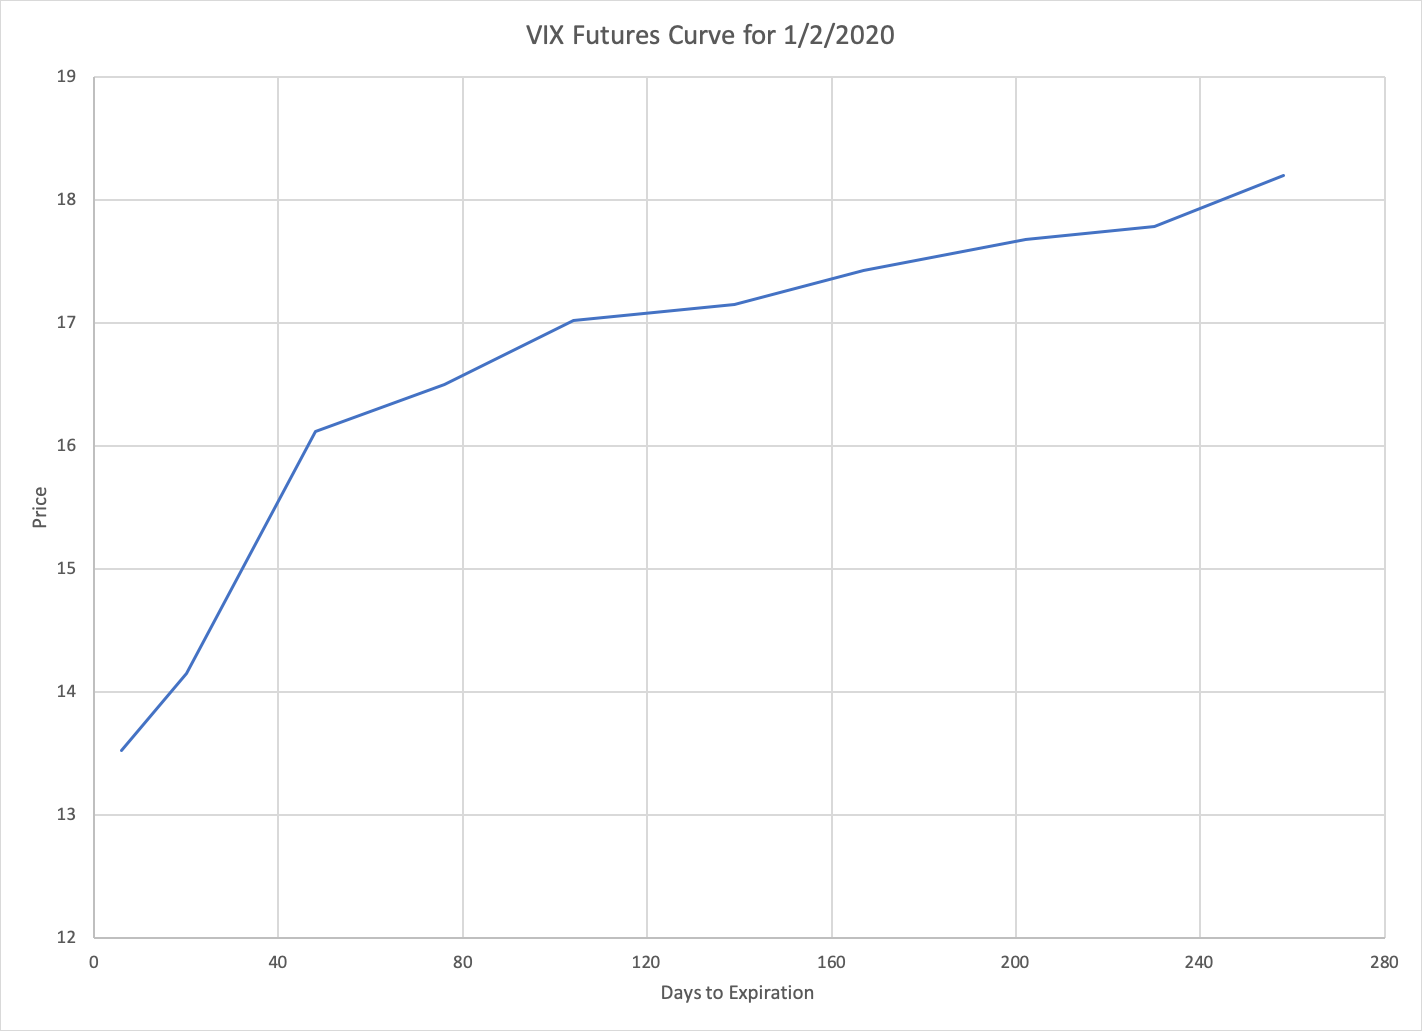
This chart shows the futures curve for the VIX — the prices of different contracts as a function of days until expiration — at the beginning of this year. The prices are in contango, meaning that contracts with expiration dates further in the future are more expensive. This contango is quite steep: the price of the February contract (expiring in 48 days) is almost 14% higher than the price of the January contract (expiring in 20 days). When VXX sells January contracts to buy February contracts, it is effectively paying a 14% premium to maintain its exposure. As long as this contango persists, the value of the portfolio of near-term contracts held by VXX is being continuously eroded.
There is a sense in which the cost of contango is not uniquely associated with the second layer of VXX’s construction. If we were to buy a future expiring in a year and hold it until expiration, we would also pay a hefty premium despite never rolling our position. But whatever layer we choose to associate this cost with, the bottom line is the same: VXX loses money because VIX futures are in contango.
This explanation, though adequate, only explains the proximate cause of VXX’s inefficiency. VXX loses money because VIX futures are usually in contango — but why are VIX futures usually in contango? The answer to this question is more murky. In Part 2 of this post, I will explore three possible explanations for this phenomenon.